 Slow Bio Hack
Introduction to Custom Sleep Dashboards
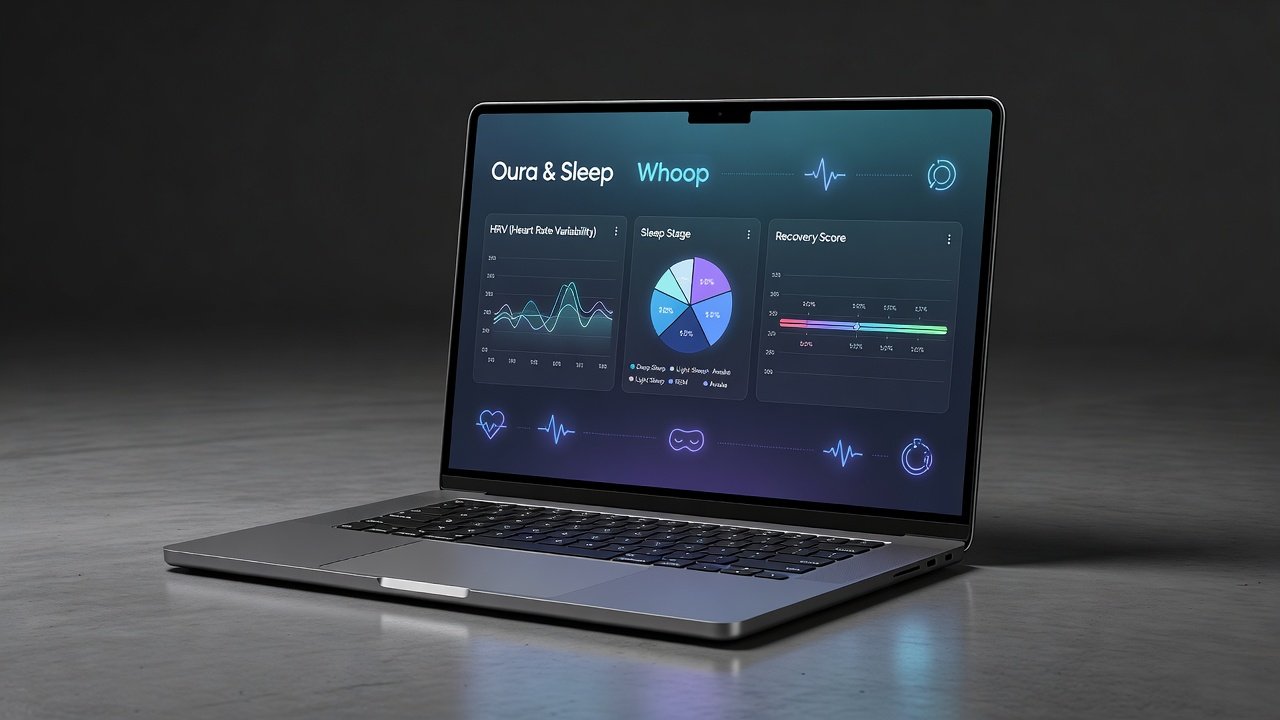
Wearable technology in 2026 offers unprecedented access to sleep and recovery metrics, yet default apps from Oura and Whoop often limit users to surface-level views. Advanced athletes and biohackers now build custom dashboards to uncover long-term patterns in HRV, sleep stages, and readiness scores. This guide walks through practical methods using APIs, Google Sheets, and no-code platforms to integrate data from both devices for deeper insights that go far beyond what individual manufacturer apps provide.
By combining Oura’s detailed sleep staging with Whoop’s strain and recovery focus, you can identify correlations that single-app views miss, such as how evening HRV trends predict next-day performance or how variations in deep sleep percentages align with elevated resting heart rates over multi-week periods. The process emphasizes automation to handle ongoing data pulls without manual exports, allowing for real-time updates that support proactive training adjustments. Many users in 2026 report improved decision-making around workout intensity and recovery protocols after implementing these personalized systems.
Exporting HRV and Sleep Stage Data from Oura and Whoop
Start by accessing raw data through official APIs. Oura provides endpoints for sleep periods, HRV averages, and stage breakdowns via their developer platform, including nightly summaries of REM, deep, and light sleep durations alongside respiratory rate and temperature deviations. Whoop offers similar access to recovery scores and heart rate variability through authenticated requests, capturing strain accumulation and sleep consistency metrics. Use secure token-based authentication to pull historical records spanning months or years, ensuring you request only the necessary scopes to maintain data privacy.
Key fields to export include nightly sleep duration, REM and deep sleep percentages, resting heart rate, and HRV RMSSD values. Schedule automated daily pulls using scripts in Python or built-in API connectors in no-code tools. This creates a unified dataset ready for visualization. For instance, one user tracked six months of data and discovered that their average HRV dropped 12% during high-travel periods, prompting schedule changes that boosted overall recovery scores by 18%.
Setting Up Automated Visualizations in Google Sheets
Google Sheets serves as an accessible hub for merging Oura and Whoop data. Begin with the IMPORTDATA or Apps Script functions to ingest API responses. Create separate tabs for raw sleep metrics, calculated readiness trends, and daily comparisons. Leverage array formulas to automatically normalize timestamps from both devices, handling time zone differences common in international travel scenarios.
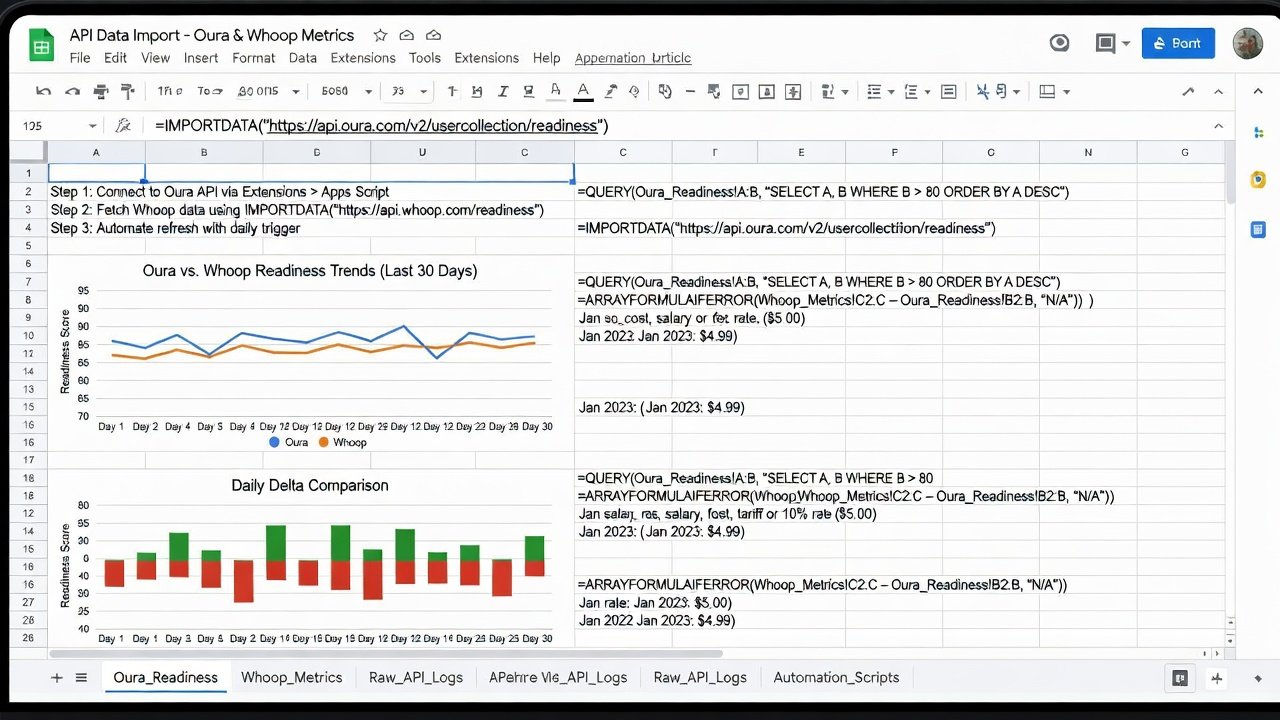
Build dynamic charts showing sleep efficiency over time alongside recovery scores. Use QUERY functions to filter data by date ranges or activity levels. For example, a line graph comparing weekly average HRV from both devices highlights device-specific variances while revealing overall recovery patterns. Add conditional formatting to flag days when combined scores drop below personal baselines. Extend this with sparklines for quick trend glances and pivot tables that aggregate monthly averages, enabling side-by-side comparisons of sleep stage distributions across seasons.
Comparing Readiness Scores and Spotting Long-Term Trends
Readiness scores from Oura and Whoop measure overlapping yet distinct factors. Plot both on the same timeline to spot divergences, such as Oura emphasizing sleep quality while Whoop incorporates strain data. Real-world users report identifying overtraining patterns weeks earlier when tracking these side-by-side. Consider a case where an endurance athlete noticed Oura readiness lagging during heavy training blocks while Whoop recovery remained moderate, leading to targeted deload weeks that prevented injury.
Analyze seasonal trends by grouping data into monthly cohorts. Look for correlations between poor sleep stages and elevated resting heart rates. Tools like pivot tables quickly surface these insights without advanced coding. Further enhance analysis by calculating rolling seven-day averages to smooth daily noise and reveal underlying recovery trajectories that inform long-term performance optimization strategies.
Integrating Multiple Devices with No-Code Platforms
No-code options like Zapier or Make.com streamline connections between Oura, Whoop, and visualization tools. Set up zaps that trigger on new sleep data entries to update a central dashboard automatically. This reduces errors from manual syncing and supports 2026 trends toward seamless multi-device ecosystems. For users managing three or more wearables, chain multiple automation paths to consolidate metrics into a single master sheet while preserving original device timestamps.
For advanced setups, link to business intelligence platforms that handle larger datasets. Ensure all integrations respect API rate limits to maintain reliable data flow. Test each automation with sample data first, verifying that HRV values align within expected tolerances before scaling to full historical imports.
2026 Trends in Wearable Tech for Performance Optimization
Emerging developments focus on AI-driven pattern recognition across wearables. Custom dashboards now incorporate predictive elements, forecasting recovery based on multi-week HRV trajectories. Users increasingly prioritize privacy-first local processing alongside cloud APIs, with many adopting hybrid setups that store sensitive metrics offline. These approaches enable actionable optimization, such as adjusting training loads based on aggregated sleep metrics rather than single-device outputs, leading to measurable gains in consistency and reduced burnout rates among competitive athletes.
Practical Tips and Common Pitfalls
- Always validate API data against app exports to catch discrepancies in HRV calculations, especially after firmware updates.
- Use encrypted storage for sensitive health information and review privacy policies before sharing tokens with third-party platforms.
- Test integrations with small date ranges first to avoid overwhelming free-tier limits in Google Sheets or automation services.
- Cross-reference with Oura and Whoop documentation for the latest endpoint changes and maintain version logs of your scripts.
- Document your personal baselines quarterly to account for natural physiological shifts over the year.
FAQ: Data Accuracy, Privacy, and Setup Challenges
How accurate is combined Oura and Whoop data? Accuracy depends on consistent wear and calibration. Cross-device comparisons often improve reliability by averaging minor sensor differences, though users should account for occasional outliers during periods of poor signal quality.
What privacy steps should I take? Store tokens securely and limit dashboard sharing. Review each company’s data policies before API access and consider anonymizing exported datasets where possible.
Can I build this without coding experience? Yes, no-code platforms handle most automation, though basic spreadsheet formulas help refine views and allow for more granular control over visualizations.
How often should dashboards update? Daily refreshes capture meaningful trends while respecting API quotas; weekly bulk updates work well for retrospective analysis.
What if data from both devices conflicts? Investigate sensor placement and activity logs first, then average values or weight them based on which device performed better during validation tests.
Conclusion
Custom Oura and Whoop sleep dashboards transform raw metrics into personalized performance tools. By following these steps for data export, visualization, and integration, users gain actionable insights that evolve with 2026 wearable advancements. Start small with one automated workflow and expand as patterns emerge, continually refining your system to match evolving training goals and recovery needs.

No comments yet. Be the first!