 Slow Bio Hack
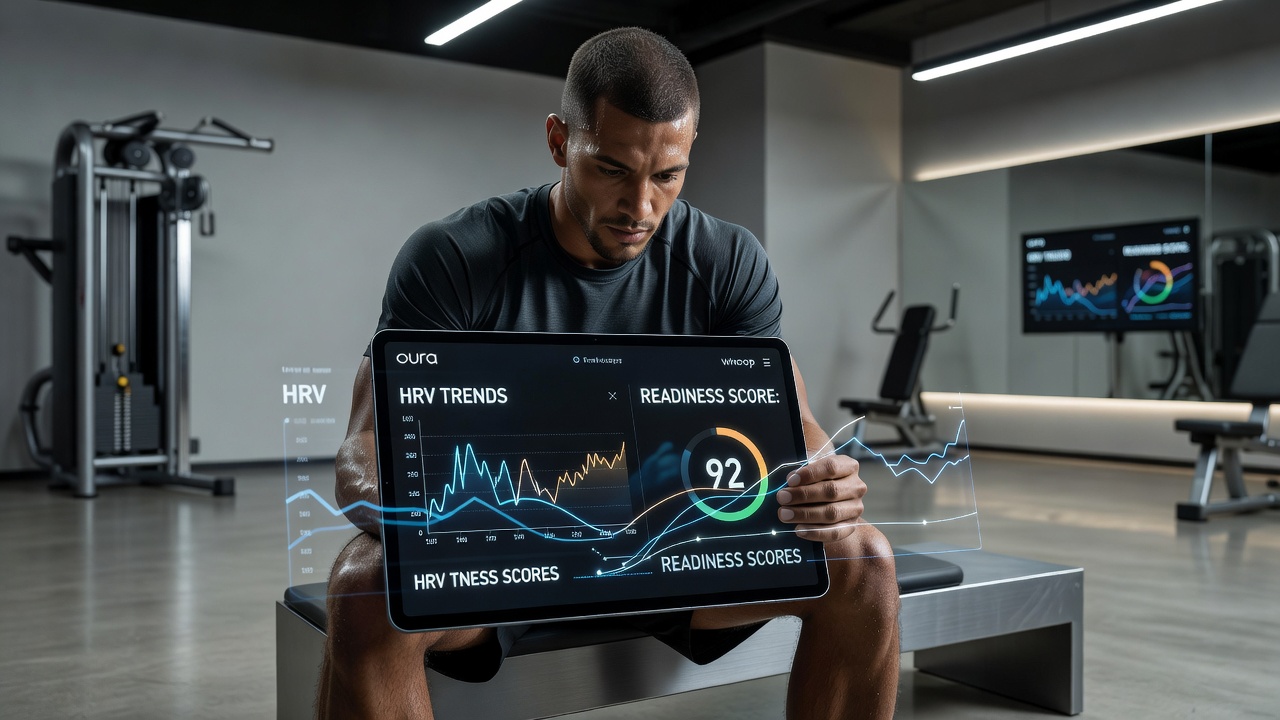
Introduction to Advanced Wearable Data Analysis
Fitness enthusiasts in 2026 are moving beyond basic step counts and sleep summaries. Devices like the Oura Ring and Whoop strap deliver rich datasets that, when analyzed properly, reveal predictive insights into recovery, training readiness, and long-term performance gains. This guide explores sophisticated interpretation techniques, visualization strategies, and practical dashboard construction to help you leverage these tools effectively. Understanding how to interpret complex signals such as heart rate variability trends over weeks rather than days allows athletes to anticipate fatigue before it impacts performance. Many users report that combining multiple data streams leads to more accurate predictions than relying on isolated metrics alone.
Core Metrics: HRV, Readiness Scores, and Activity Patterns
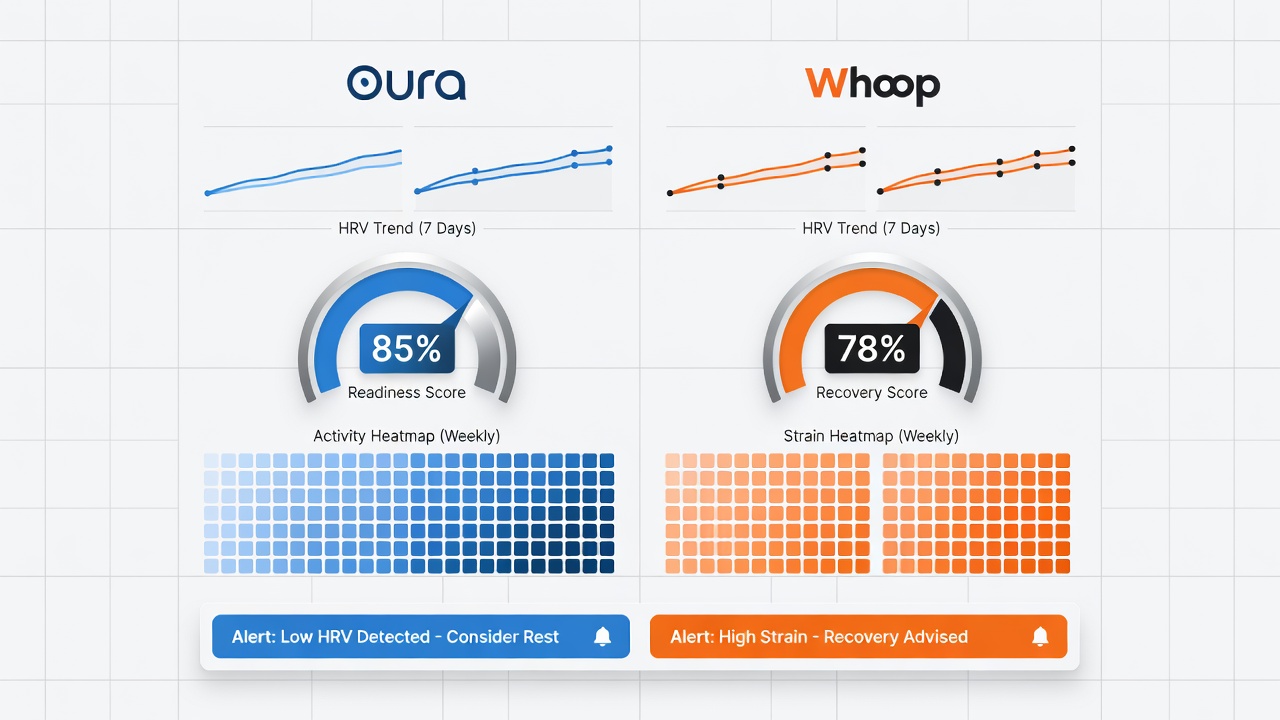
Heart rate variability (HRV) serves as a primary indicator of autonomic nervous system balance. Higher baseline HRV typically signals better recovery capacity, while sudden drops can forecast overtraining or illness. Oura provides nightly HRV averages alongside readiness scores that combine HRV with resting heart rate, body temperature, and sleep quality. Whoop calculates a daily recovery percentage driven heavily by HRV, respiratory rate, and sleep performance. Cross-referencing these allows users to identify patterns such as consistent HRV suppression following high-intensity sessions. For instance, a runner logging consistent evening runs may notice a 15-20% HRV reduction the following morning, indicating the need for lighter subsequent workouts. Activity patterns extend beyond total strain or active calories. Examining the timing of elevated heart rates relative to sleep cycles and HRV trends helps pinpoint optimal training windows. Athletes often discover that afternoon sessions produce superior HRV recovery compared to evening workouts when analyzed over multiple weeks. Predictive modeling emerges when users track how temperature deviations interact with these metrics to forecast immune challenges days in advance.
Data Visualization Tools for Deeper Insights
Native apps offer limited graphing capabilities. Advanced users export data via CSV or API integrations into platforms like Google Sheets, Tableau Public, or Python libraries such as Pandas and Matplotlib. These tools enable custom multi-metric overlays, such as plotting HRV against weekly training load to visualize dose-response relationships. Oura Ring and Whoop both support data export features that facilitate these deeper explorations. Users can create heatmaps showing correlations between sleep stages and next-day strain tolerance, revealing hidden inefficiencies. For those comfortable with scripting, automated scripts can flag anomalies like unexpected respiratory rate spikes that precede readiness declines.
Setting Up Custom Alerts and Thresholds
Preventive action begins with tailored notifications. Configure alerts for HRV falling below a personal 7-day rolling average by more than 10% or readiness scores dipping under 70 for two consecutive days. Many users integrate third-party services like IFTTT or Zapier to trigger Slack or email notifications when these thresholds are breached, enabling rapid adjustments to training plans. Consider layering alerts for secondary signals such as resting heart rate increases above baseline by 5 beats per minute, which often compound HRV warnings. Testing alert sensitivity over a two-week calibration period prevents notification fatigue while catching genuine recovery risks early.
Step-by-Step Guide to Building Personal Dashboards
Creating a robust personal dashboard requires systematic data handling. Begin by exporting the last 90 days of Oura and Whoop data into separate spreadsheets. Align timestamps and create a unified master sheet with columns for date, HRV, readiness/recovery, strain, sleep score, and resting heart rate. Apply conditional formatting to highlight days where HRV and readiness diverge significantly, such as high readiness paired with low HRV, which may indicate measurement artifacts. Generate line charts for trend visualization and scatter plots to correlate metrics with subjective energy levels logged manually. Add pivot tables to segment data by weekday or training type, uncovering weekly patterns like weekend recovery advantages. Schedule weekly reviews to refine thresholds based on observed performance outcomes. Incorporate manual notes columns for variables like diet changes or travel to contextualize anomalies. Over time, these dashboards evolve into predictive tools that suggest optimal rest days with increasing accuracy.
Cross-Referencing with Additional Fitness Trackers
Combining Oura and Whoop data with devices like Garmin or Apple Watch adds layers of validation. Garmin’s training readiness metric, for instance, can confirm or contradict Whoop recovery percentages. Users report higher predictive accuracy when averaging normalized scores across platforms rather than relying on any single source. This triangulation reduces false positives from device-specific sensor noise and provides a fuller picture of cardiovascular adaptation. For example, aligning Garmin’s body battery data with Oura temperature trends helps distinguish between training-induced fatigue and environmental stressors.
Common Interpretation Errors and How to Avoid Them
- Overreacting to single-day fluctuations without considering 7- to 14-day trends, which can lead to unnecessary rest days and stalled progress.
- Ignoring external factors such as travel, illness, or alcohol consumption that temporarily skew HRV and require manual overrides in analysis.
- Assuming higher readiness always means higher performance; some athletes peak on moderate readiness days due to supercompensation effects observed after strategic deloads.
- Neglecting device calibration periods after firmware updates or strap replacements, which can introduce temporary data drift lasting up to five days.
- Failing to account for seasonal variations, such as lower baseline HRV during winter months, leading to miscalibrated personal thresholds.
Real-World User Scenarios
A competitive cyclist noticed recurring HRV drops correlating with high evening strain scores. After shifting intense rides to mornings and implementing earlier wind-down routines, average readiness improved by 12 points over six weeks, translating to better race-day outputs. Another user, a recreational runner, discovered that low Oura temperature deviations often preceded poor Whoop recovery readings, prompting earlier intervention with hydration and light mobility work that reduced injury downtime. A third example involves a triathlete who built a dashboard revealing that high weekly swim volume suppressed HRV more than equivalent running loads; adjusting swim intensity accordingly improved overall recovery consistency across the season.
FAQ: Privacy Concerns with Detailed Wearable Data
How is my biometric data stored and shared? Both Oura and Whoop encrypt data in transit and at rest. Review each company’s privacy policy for details on third-party sharing and research partnerships, which often require opt-in consent for anonymized datasets.
Can employers or insurers access my information? Data sharing requires explicit user consent. Most policies prohibit automatic transmission to external organizations without permission, though users should periodically audit connected third-party apps.
What steps protect against data breaches? Enable two-factor authentication, regularly audit connected apps, and consider using anonymized export options for personal analysis to minimize exposure.
Are there regulations governing this data? Wearable health data falls under frameworks similar to HIPAA in certain jurisdictions when processed by covered entities; users should stay informed about evolving standards through official channels.
Conclusion
Mastering advanced analysis of Oura and Whoop data transforms raw numbers into actionable performance intelligence. By combining visualization, custom alerts, cross-device validation, and disciplined interpretation habits, athletes can achieve consistent gains in output and recovery throughout 2026 and beyond.

No comments yet. Be the first!